Elevation profile of Spain in R
From Picos de Europa to Sierra Nevada #
Have you ever wondered what would be of Spain if you cut it in half? What is there after Despeñaperros? Which is taller, meseta norte or meseta sur? How come Ávila is the highest capital province in Spain?!
I did, and here is the result:
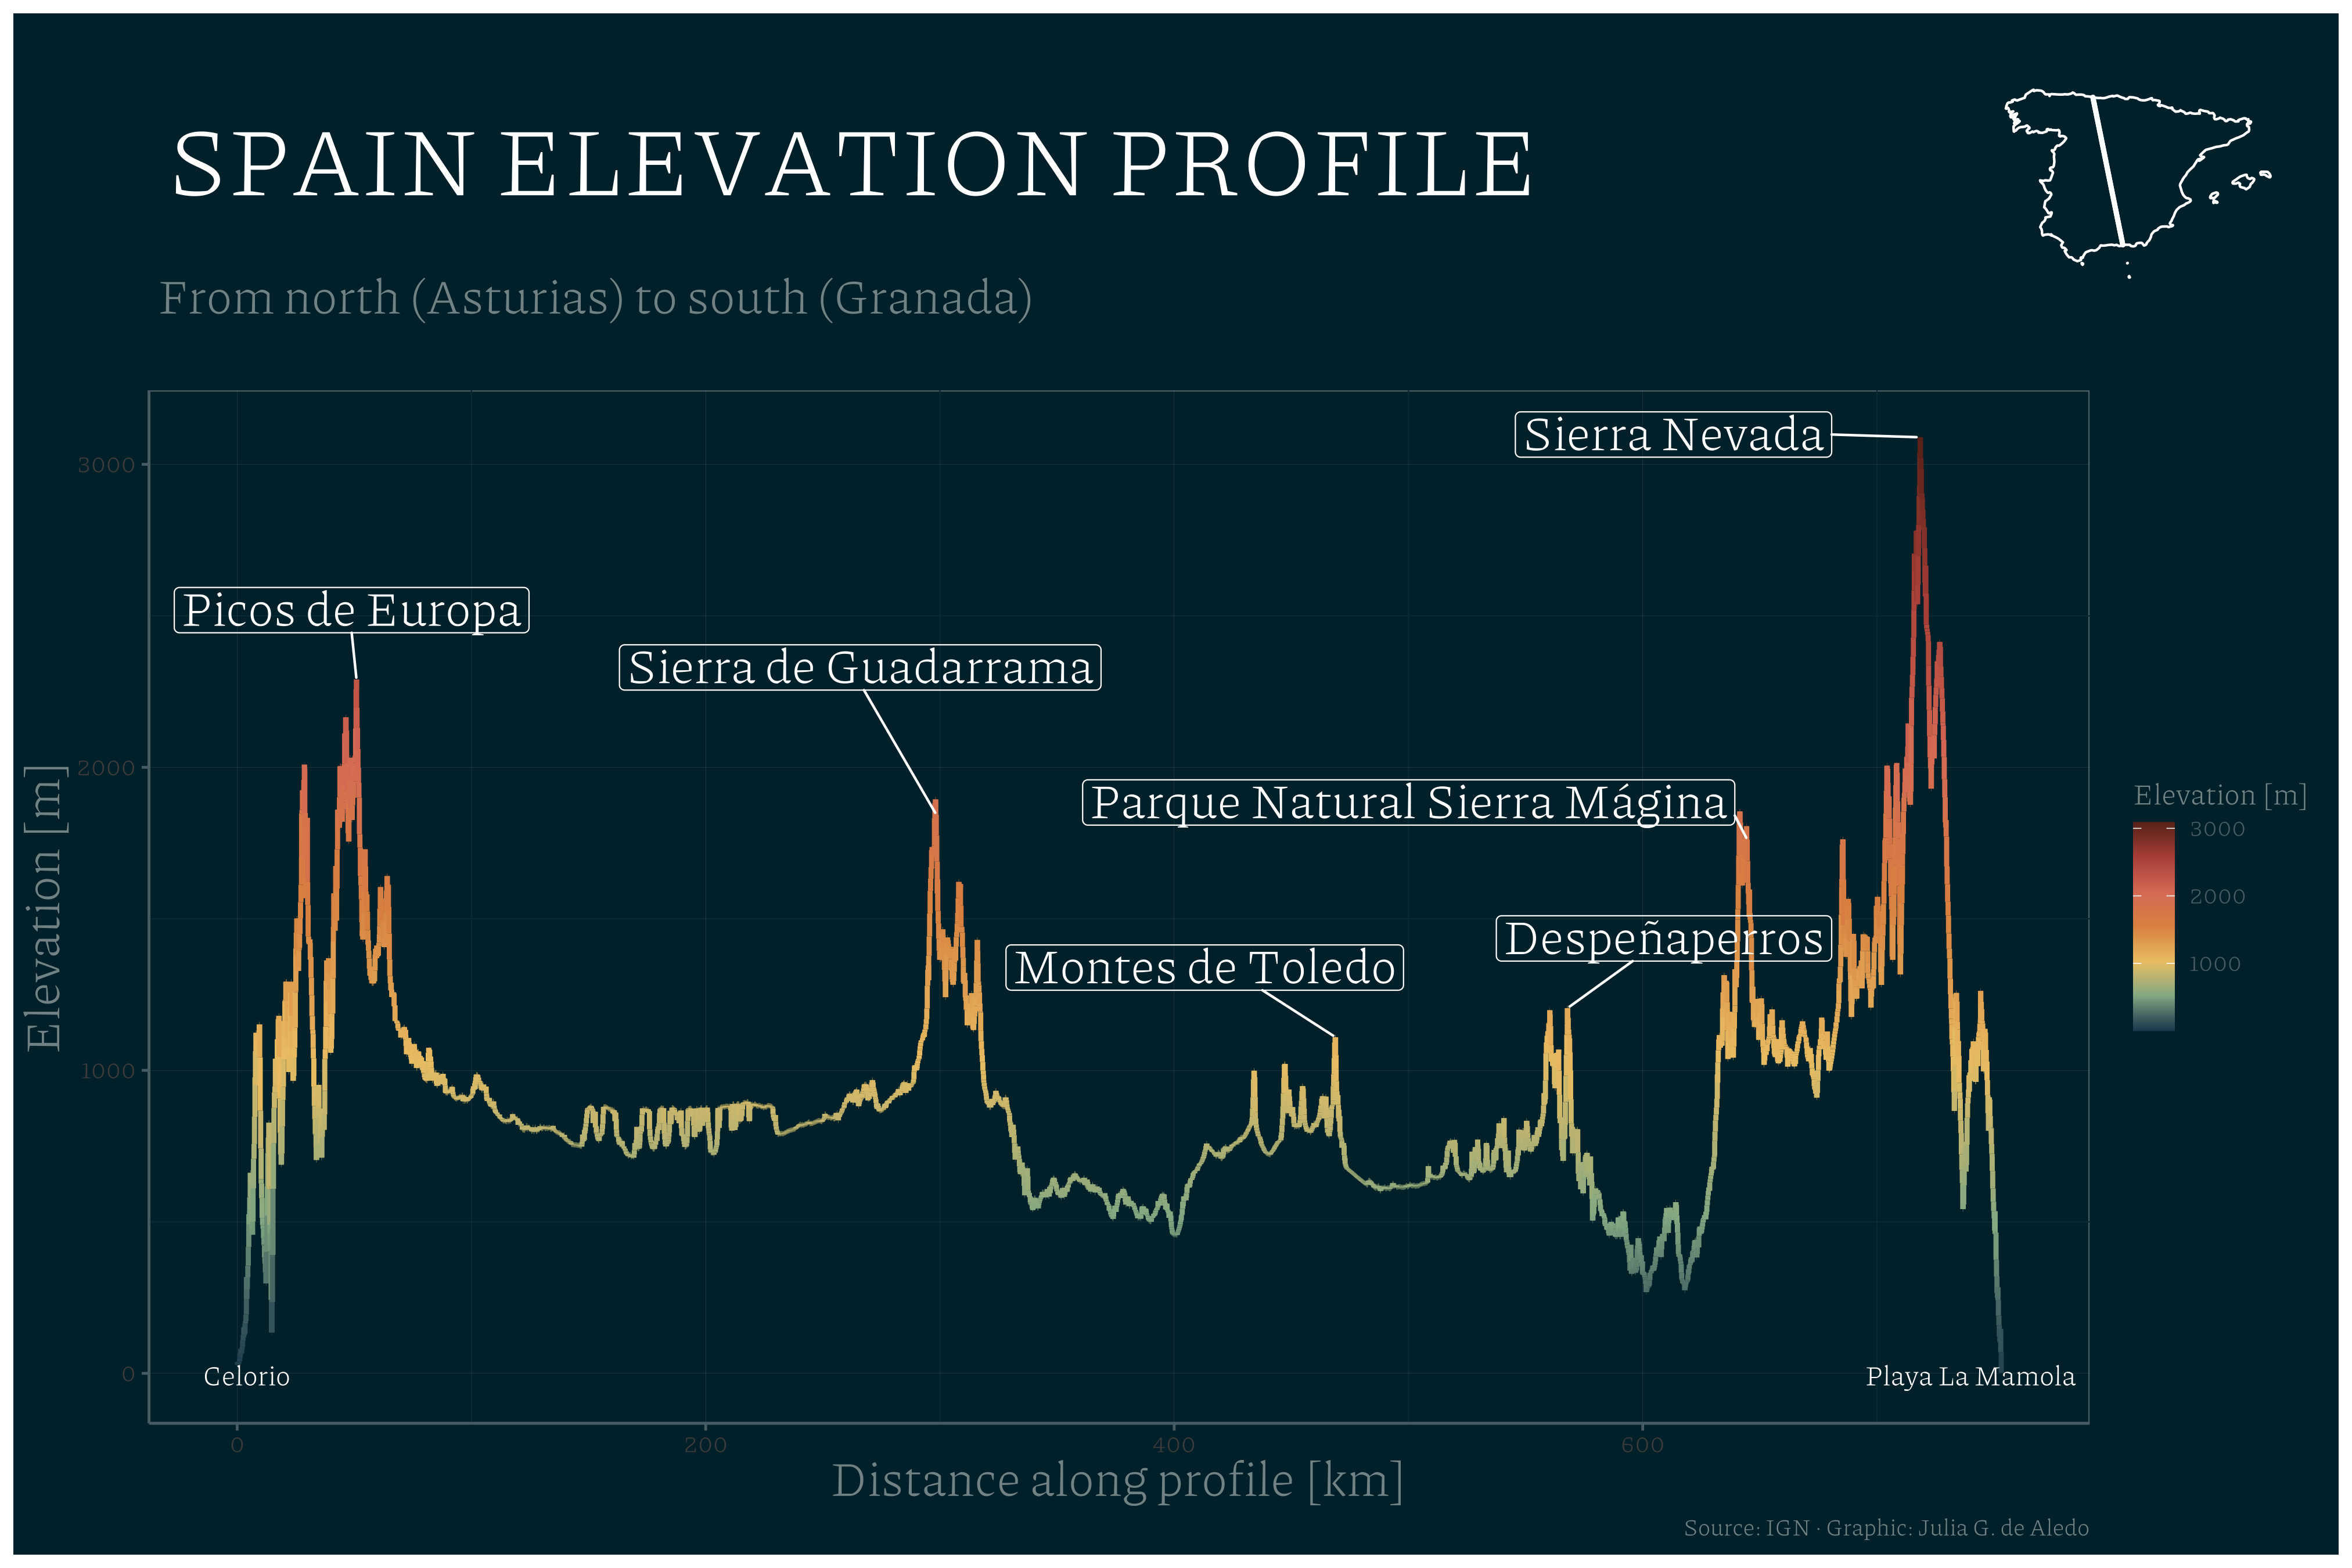
Indeed, after Despeñaperros, there is a big hole.
Here are some tips to your elevation profile in R
Step by step #
-
Download DEM (e.g. for Spain: IGN)
-
Download line shapefile with the trajectory of your profile (e.g. from GIS)
-
Download world map contour countries
-
Load all to R
-
Convert line to points
# Obtain line elevation values line2 <- spTransform(line, "+init=epsg:25830") psp <- as.psp.SpatialLines(line2) pts <- pointsOnLines(psp, eps=10) # Convert to spatial points pts1 <- SpatialPoints(coords = cbind(pts$x, pts$y), proj4string = CRS("+init=epsg:25830")) pdf_data <- as.data.frame(pts1) -
Calculate elevation and distance
pdf_data$dem <- raster::extract(r0, pts1) pdf_data$dist <- seq(0, (nrow(pdf_data)-1)*10, 10) pdf_data$dist <- pdf_data$dist/1000 # to km -
Plot it with ggplot
-
geom_linewith MetPalettes color Hokusai -
geom_label_repelto add the labels -
theme_solarizedfor background color -
geom_polygonto plot the Spain contour -
inset_elementto add it to the previous graph
-
You can find the full code here